Total Blocking Time: What It Is and What Benchmark Your Website Should Hit
Total Blocking Time is the lab metric that tells you whether your website feels frozen while it loads. A page can paint quickly and still ignore every tap and click for several seconds because JavaScript is hogging the browser's main thread. TBT puts a number on that frozen period, and it carries more weight in your Lighthouse performance score than any other single metric. Here is what the numbers mean, what benchmark to aim for, and how to bring a high TBT down.

Khul Anwar
Growth

TL;DR: Total Blocking Time (TBT) measures how long your website's main thread is blocked by long JavaScript tasks between First Contentful Paint and Time to Interactive. The benchmark to hit is 200 milliseconds or less in Lighthouse. Between 200 and 600 ms needs improvement, and anything over 600 ms is poor. To reduce TBT, cut JavaScript execution, defer or remove third-party scripts, break up long tasks, and on WordPress, deactivate plugins that load scripts sitewide.
Total Blocking Time is the lab metric that tells you whether your website feels frozen while it loads. A page can paint quickly and still ignore every tap and click for several seconds because JavaScript is hogging the browser's main thread.
TBT puts a number on that frozen period, and it carries more weight in your Lighthouse performance score than any other single metric. Here is what the numbers mean, what benchmark to aim for, and how to bring a high TBT down.
What Does Total Blocking Time Mean?
When a browser loads your page, all the JavaScript work runs on a single main thread. That same thread also handles user input. If a script runs as one long uninterrupted task, the browser cannot respond to a tap, click, or keypress until the task finishes. To the visitor, the page looks loaded but acts dead.
Total Blocking Time measures this. It looks at every task on the main thread between First Contentful Paint (when content first appears) and Time to Interactive (when the page reliably responds to input).
Any task longer than 50 milliseconds is a "long task," and everything beyond that 50 ms threshold counts as blocking time. TBT is the sum of all those blocking portions.
A quick example: if your page runs three tasks of 80 ms, 120 ms, and 250 ms, the blocking portions are 30 ms, 70 ms, and 200 ms. Your TBT is 300 ms.
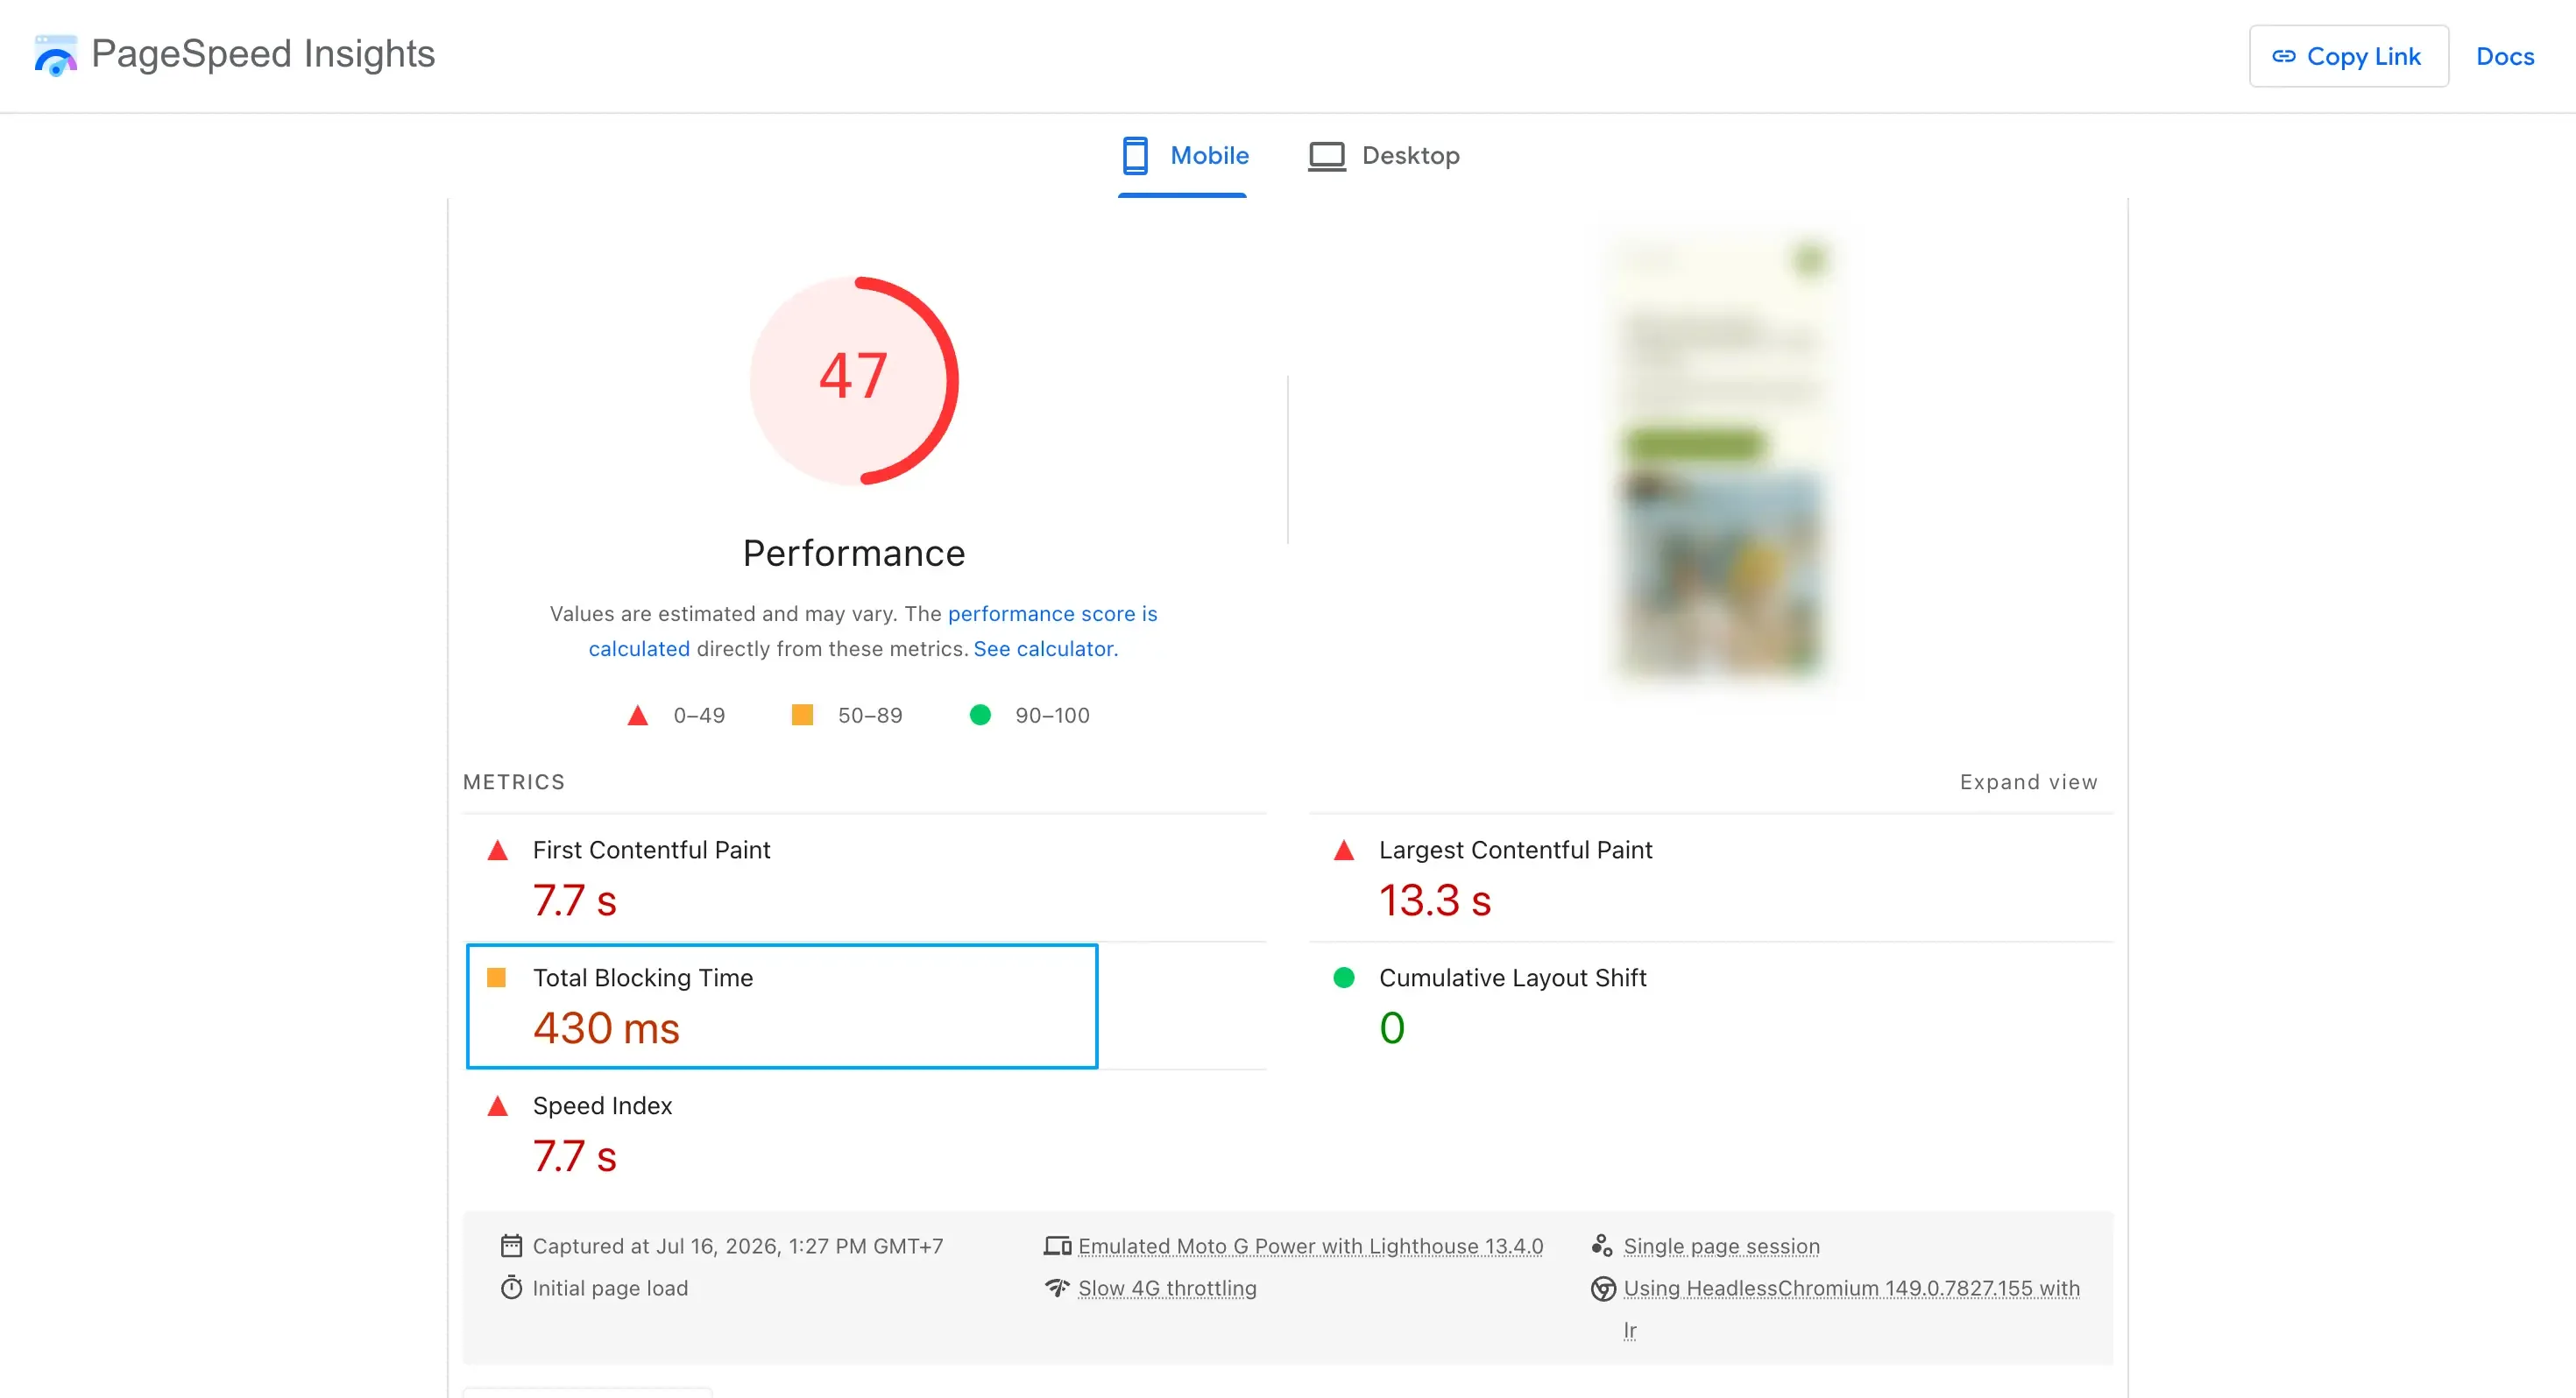
Only the portion of each task beyond 50 ms counts as blocking time.
One important distinction: TBT is a lab metric. It shows up in Lighthouse, PageSpeed Insights, and GTmetrix, but it is not measured from real users in the field. Its real-world counterpart is Interaction to Next Paint (INP), the Core Web Vital that replaced First Input Delay in 2024.
Total Blocking Time (TBT) and Interaction to Next Paint (INP) usually move together, so improving one improves the other. Think of TBT as the diagnostic you can run on demand, and INP as the grade real visitors give you.
Total Blocking Time Benchmark: What Is a Good Score?
Google's Lighthouse thresholds, measured on average mobile hardware, are the standard benchmark:
| TBT | Rating |
|---|---|
| 0 to 200 ms | Good |
| 200 to 600 ms | Needs improvement |
| Over 600 ms | Poor |
Aim for 200 ms or less. And this benchmark deserves more of your attention than most, because TBT is the heaviest weighted metric in the Lighthouse performance score, accounting for 30 percent of the total. A site can have decent paint metrics and still score in the 50s purely because of a bloated TBT.
How the Performance score is weighted
The Performance score is a weighted average of all metric scores. Metrics with higher weights have a greater impact on your overall score. Use the Lighthouse Scoring Calculator to explore how the score is calculated interactively.
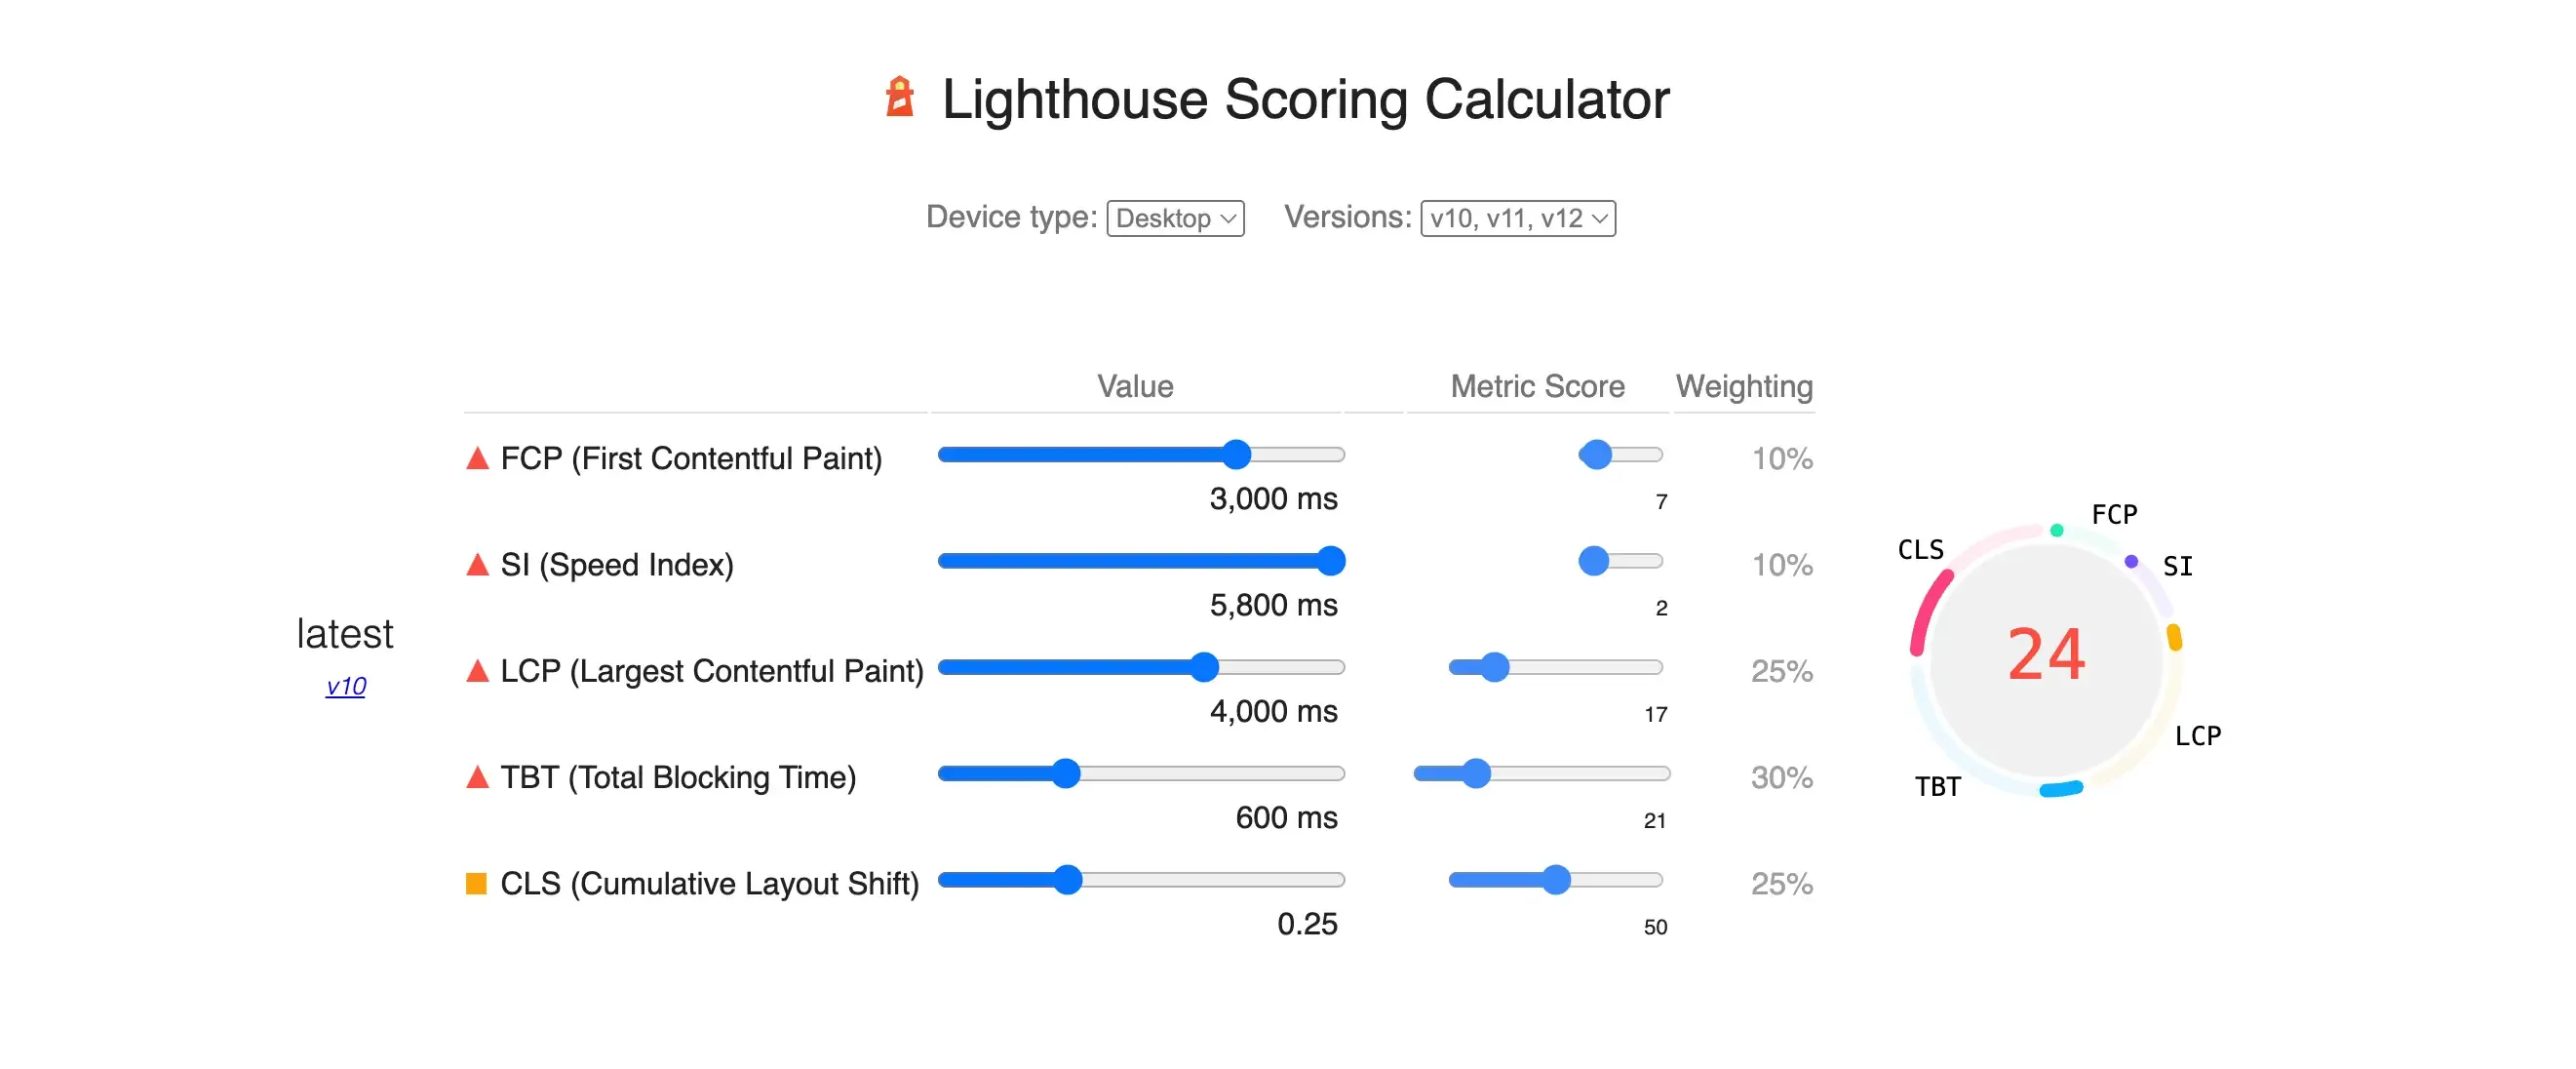
GTmetrix uses the same underlying Lighthouse engine, so the same thresholds apply there. If GTmetrix reports a high TBT, it means the same thing: too much JavaScript running in long, uninterrupted chunks. Keep in mind that lab TBT varies between runs and between tools, because it depends on the simulated device and network. A swing of 50 to 100 ms between tests is normal. What matters is the range you consistently land in, not a single run.
Why Total Blocking Time Matters for SEO
Google does not rank pages on TBT directly, since Core Web Vitals are measured from field data and TBT is lab-only. But the connection is real, in two ways.
First, TBT is the best lab predictor of INP, and INP is a Core Web Vital that feeds into Google's page experience signals. A page with 900 ms of blocking time in the lab will almost certainly deliver sluggish interactions to real users, and that shows up in field data.
Second, blocking time destroys conversions independent of rankings. A visitor who taps a menu or a "Get a Quote" button on a frozen page and gets nothing usually taps again, gets frustrated, and leaves. On mobile, where CPUs are slower and TBT is always worse, this is one of the quietest ways a website loses leads.
How to Fix Total Blocking Time
Every TBT fix comes down to one principle: make the main thread do less work, in smaller pieces.
Reduce and Defer JavaScript
Start with the biggest lever. Run PageSpeed Insights and open the "Reduce JavaScript execution time" and "Minimize main-thread work" diagnostics to see which scripts cost the most.
- Defer non-critical scripts with the
deferattribute so they execute after parsing instead of blocking it - Remove dead code. Analytics tools you stopped using, old chat widgets, and duplicate tracking snippets all still execute on every load
- Code split larger bundles so each page loads only the JavaScript it actually needs
Tame Third-Party Scripts
Third-party code is the most common TBT killer, because you cannot optimize what someone else wrote. Tag managers, ad scripts, heatmaps, social embeds, and chat widgets frequently contribute more blocking time than your own site. Audit each one and ask whether it earns its cost. For those you keep, load them after the page becomes interactive, or use facades (a lightweight placeholder that loads the real widget on click), which works especially well for chat widgets and video embeds.
Break Up Long Tasks
If your own code runs tasks over 50 ms, split them. Yield to the main thread between chunks of work so the browser can handle input in the gaps, and move genuinely heavy computation into a web worker, which runs off the main thread entirely.
Reducing TBT in WordPress
WordPress deserves its own list because the causes are so predictable:
- Deactivate plugins you do not need. Every active plugin can add scripts, and many load them on every page whether used or not
- Use a performance plugin to delay JavaScript execution. Delaying scripts until first user interaction is often the single biggest TBT win on WordPress
- Replace heavy page builders on key pages. Builders that ship large runtime JavaScript inflate TBT sitewide
- Watch your theme. Multipurpose themes bundle sliders, animations, and icon libraries you may never use, and all of it executes anyway
The Problem: TBT Regresses Silently
Here is the pattern that catches most site owners. You spend a weekend optimizing, get TBT under 200 ms, and move on. Three months later a new marketing pixel gets added, a plugin update ships a heavier script bundle, and a chat widget changes how it loads. TBT is back over 600 ms, and nobody ran a Lighthouse test that day. The first symptom anyone notices is fewer form submissions, and by then it has been costing leads for weeks.
Performance is not a project you finish. It is a condition you maintain, and that requires something checking continuously rather than someone remembering to test.
This is exactly the gap Kapient covers. It scans your website around the clock across more than 74 technical and quality factors, catching performance slowdowns along with the errors that often ride along with script changes, like broken forms and plugin failures.
When something goes wrong, Kapient sends you an email alert explaining the issue.
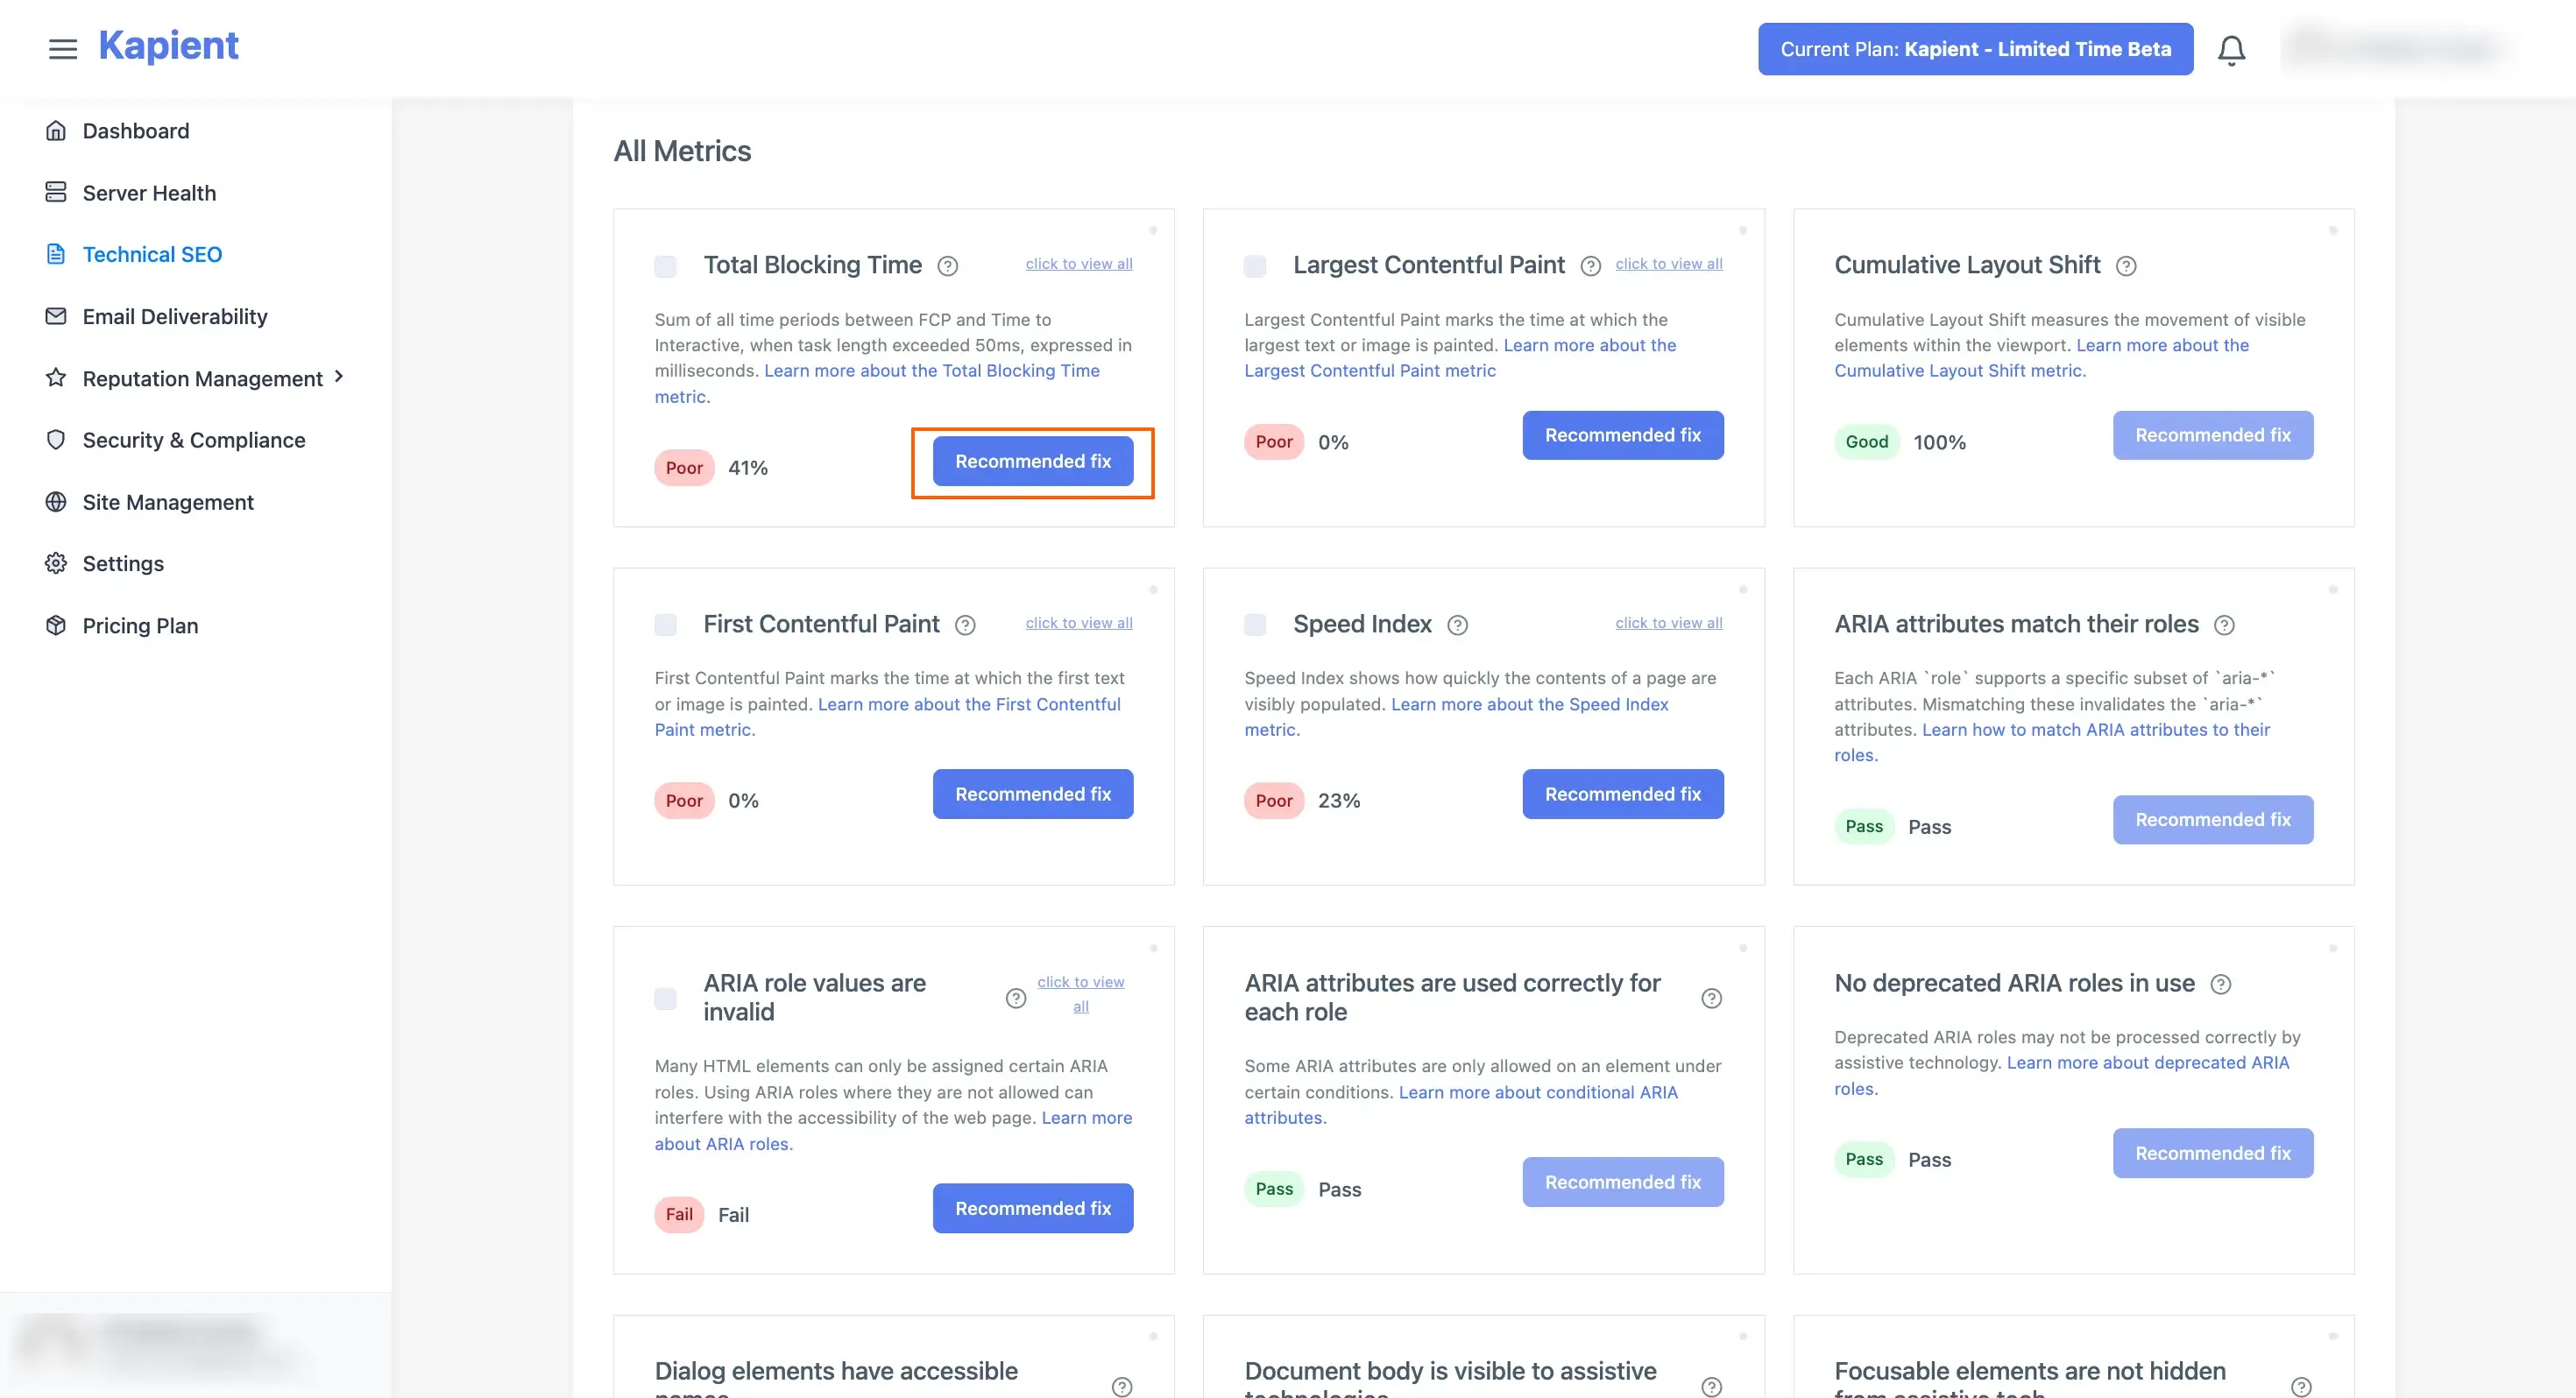
Simply click the Recommended Fix button on any detected issue to get step-by-step guidance tailored to your website's tech stack.
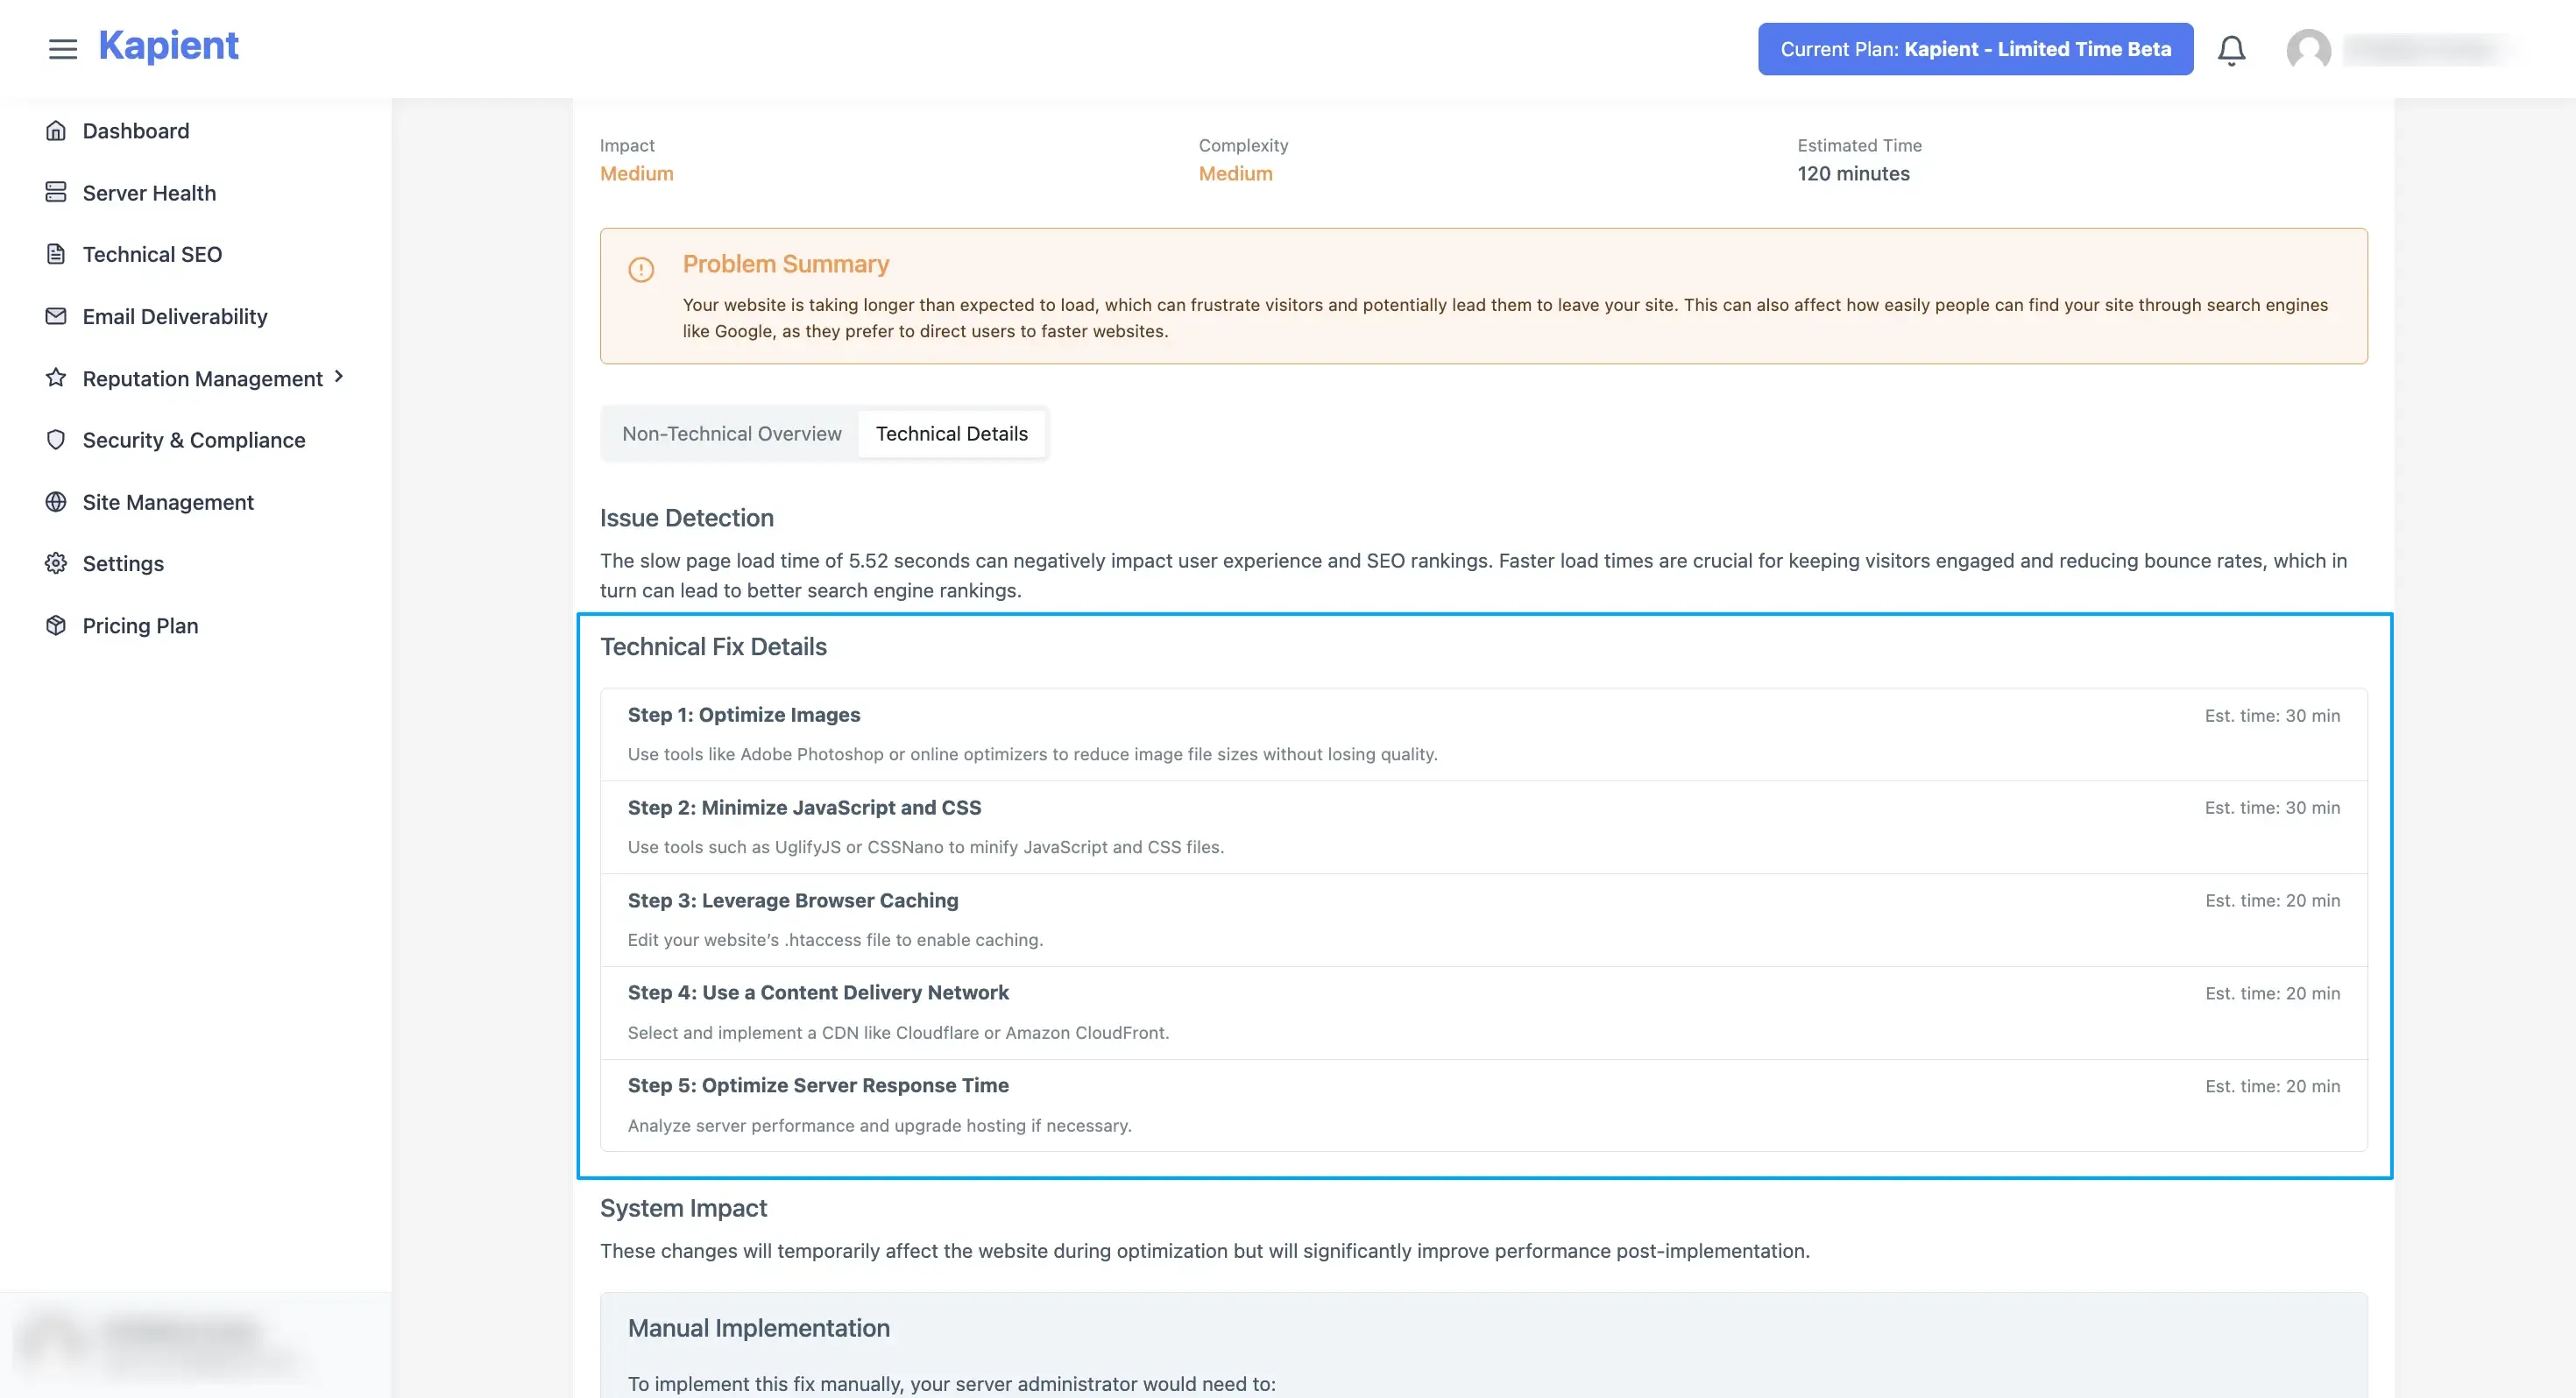
For agencies and freelancers on maintenance retainers, that turns a silent regression on a client site into a same-day fix and a concrete line item in the monthly report, instead of an awkward conversation after the client's conversions drop.
Your TBT was fine last month. Is it fine today? Kapient monitors your website 24/7, detects performance drops and hidden errors the moment they appear, and gives you plain-English fix instructions. Start monitoring your client's website for free
Frequently Asked Questions
What is a good Total Blocking Time benchmark?
200 milliseconds or less is good, 200 to 600 ms needs improvement, and over 600 ms is poor. These are Lighthouse's thresholds, measured on simulated mid-range mobile hardware.
What does Total Blocking Time mean?
TBT is the total time between First Contentful Paint and Time to Interactive during which the browser's main thread was blocked by tasks longer than 50 milliseconds. It quantifies how long a page looks loaded but cannot respond to user input.
Is Total Blocking Time a Core Web Vital?
No. TBT is a lab metric, so it cannot be measured from real users. Its field counterpart is Interaction to Next Paint (INP), which is a Core Web Vital. Improving TBT almost always improves INP as well.
What is TBT in GTmetrix?
GTmetrix runs on the Lighthouse engine, so its TBT is the same metric with the same thresholds. Because TBT carries 30 percent of the Lighthouse performance score, a high TBT is often the main reason for a low GTmetrix grade.
How do I reduce Total Blocking Time in WordPress?
Deactivate unnecessary plugins, use a performance plugin that delays JavaScript execution until user interaction, avoid heavy page builders on important pages, and audit third-party scripts like chat widgets and tracking pixels. Delayed JavaScript execution is usually the biggest single win.
Does Total Blocking Time affect SEO?
Indirectly. Google's ranking signals use field data, and TBT is lab-only, but high TBT reliably predicts poor INP, which is a Core Web Vital. High blocking time also hurts conversions directly by making pages unresponsive to taps and clicks.
Written by
Khul Anwar
Growth
Khulanwar leads content and growth at Kapient, where the team helps small businesses and agencies keep their websites healthy, fast, and compliant. He writes about website monitoring, technical SEO, and the maintenance work that quietly keeps sites from breaking after launch.
Related articles

10 Common WCAG Failures and How to Fix Them
September 22, 2026

Website Accessibility for Agencies: Turning Compliance Into a Service
September 16, 2026
10 Best UptimeRobot Alternatives for 2026
September 10, 2026

How to Check if Your Website Meets WCAG Accessibility Standards
September 10, 2026